Overview
The Cisco Unity
Connection Port Status Monitor (PSM) allows you to monitor Cisco Unity
Connection voice port activity in real time.
Requirements/Special Notes
![]() Requires Cisco Unity Connection 1.1.0(1) or
greater.
Requires Cisco Unity Connection 1.1.0(1) or
greater.
![]() Must run on the Cisco Unity Connection server
being monitored.
Must run on the Cisco Unity Connection server
being monitored.
Usage
The PSM allows you to view activity, in the form of port activity messages, on one of more of Cisco Unity Connection’s voice ports in real time.
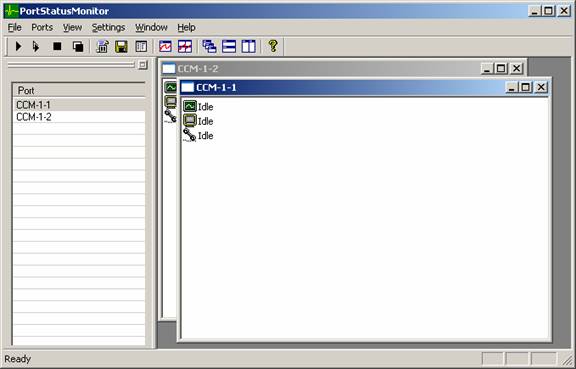
Figure 1
Activity on each port is displayed in a separate window. Each window can display any or all of three different traces:
|
Icon |
Trace |
Information |
|
|
Application |
High-level application state
information |
|
|
Display |
Information used for the web-based
Status Monitor |
|
|
Conversation |
Detailed conversation state
information |
Traces are displayed in status monitor windows in the order in which they are received from Cisco Unity Connection.
Ports Menu
Start Selected
Toolbar
icon: ![]()
Starts the status monitor window for the port highlighted in the Ports Bar. If the status monitor window is already started, has no effect.
Stop Selected
Toolbar
icon: ![]()
Stops the status monitor window for the port highlighted in the Ports Bar. If the status monitor window is already stopped, has no effect.
Clear Selected
Toolbar
icon: ![]()
Clears all traces from the status monitor window for the port highlighted in the Ports Bar, then captures the current status for each active trace.
Start All
Toolbar
icon: ![]()
Starts status monitor windows for all ports. If some ports already have status monitor windows started, will only start status monitor windows for those ports that have no currently active window.
Stop All
Toolbar
icon: ![]()
Stops all active status monitor windows.
Clear All
Toolbar
icon: ![]()
Clears all traces from all active status monitor windows, then captures the current status for each active trace.
Pause All Active
Toolbar
icon: ![]()
Turns on and off the auto-scroll feature for all active status monitor windows. By default, the auto-scroll feature causes status monitor window information to scroll so that the most recent trace information is always visible. If you turn off the auto-scroll feature, all status monitor windows will stop scrolling and must be manually scrolled.
Log All Active
Toolbar
icon: ![]()
Turns on and off file logging for all active port status monitors. When you turn on file logging, the Ports Status Monitor will capture all port status traces to a log file, identified when you activate the feature, as in Figure 2:
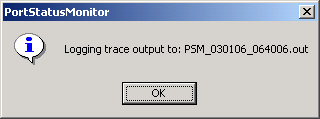
Figure 2
The output file will be saved in the directory where the Ports Status Monitor is installed, and will be formatted as a comma-seperated value (CSV) file. An example file is shown in Figure 3.
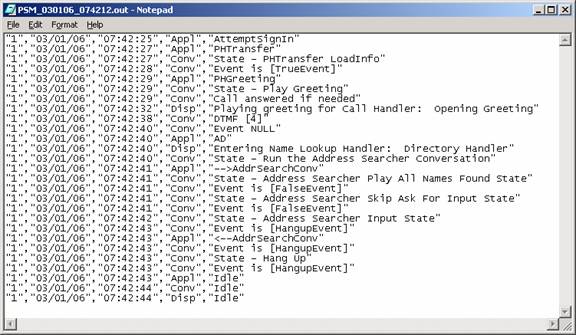
Figure 3
The columns in the log output file are:
|
Port |
The voice port being logged. |
|
Date |
The date the trace was received |
|
Time |
The time the trace was received |
|
Trace |
The trace received, either Application, Display, or
Conversation |
|
Info |
The actual text of the trace received |
View Menu
Ports Bar
Toolbar icon: None
Toggles display of the Ports Bar.
ToolBar
Toolbar icon: None
Toggles display of the Tool Bar.
Status Bar
Toolbar icon: None
Toggles display of the Status Bar.
Settings Menu
Application
Toolbar icon: None
Toggles the application trace on and off
Display
Toolbar icon: None
Toggles the display trace on and off
Conversation
Toolbar icon: None
Toggles the conversation trace on and off
Real Time Display
Toolbar
icon: ![]()
Toggles the one-line real time status display on and off. The one-line real time status display adds a column to the ports bar that displays the most recent Display Trace for each port, as shown in Figure 4.
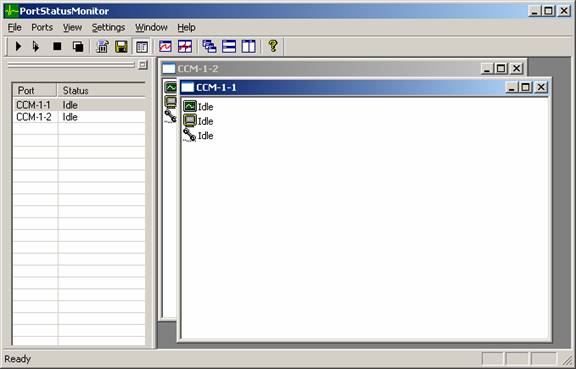
Figure 4
Trace Properties
Toolbar icon: None
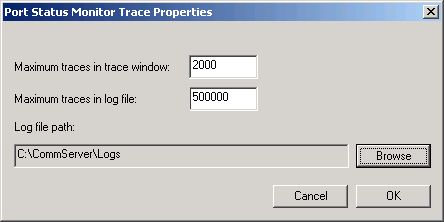
Figure 5
Maximum traces in trace window: Each port status monitor window will continue to accumulate traces up to a limit you can specify in the Trace Properties dialog, shown in Figure 5. You may enter a value between 1 and 1,000,000. As traces in a status monitor window reach the limit specified, the oldest traces will be removed from the window to make room for new traces. This has no effect at all on file logging of status monitor traces.
Maximum traces in log file: When you choose to log trace information to a file, the file will continue to grow until a maximum number of lines have been added to the file. You may enter a value between 1 and 10,000,000. When the currently open trace file becomes full, a new trace file will be opened for further trace logging.
Log File path: You may choose where the Port Status Monitor writes its log files. By default, the Port Status Monitor will save its log files to the directory in which it is installed. If you change the location for log files, the new setting will take effect the next time you begin logging traces.
Window Menu
Cascade
Toolbar
icon: ![]()
Cascades all open status monitor windows.
Tile Horizontally
Toolbar
icon: ![]()
Tiles all open status monitor windows horizontally.
Tile Vertically
Toolbar
icon: ![]()
Tiles all open status monitor windows vertically.
Command Line Options
The Cisco Unity Connection Port Status Monitor supports some command line options. You may run PSM from the command line uing the following syntax:
PortStatusMonitor
[/a][/c][/d]
The command line options have the following meanings:
/a – monitor all ports for application traces and log traces to a file while the PSM is open.
/c – monitor all ports for conversation traces and log traces to a file while the PSM is open.
/d – monitor all ports for display traces and log traces to a file while the PSM is open.
All three command line options cause the PSM to open a file called PSM_STEALTH_<DATE>_<TIME>.csv, with the date and time the file was opened as part of the file name. This file will contain all of the specified traces for all ports on the Cisco Unity Connection system for the entire time the PSM is open and active. There is no way to turn off these traces without shutting down the PSM.
Revision History
Version 1.0.0.1
![]() Initial version.
Initial version.
Version 1.0.0.3
![]() Added help, fixed defects, modified icons.
Added help, fixed defects, modified icons.
Version 1.0.0.4
![]() Added command line options for trace capture.
Added command line options for trace capture.
Version 1.0.0.5
![]() Expanded year in log file time stamps to 4
digits.
Expanded year in log file time stamps to 4
digits.
Version 1.0.0.6
![]() Added log file limits.
Added log file limits.
Version 1.0.0.7
![]() Fixed version display in about box.
Fixed version display in about box.
Version 1.0.0.8,
![]() Added updated version check.
Added updated version check.
Version 1.0.0.9,
![]() Added setting to log traces to directory of
user’s choice.
Added setting to log traces to directory of
user’s choice.
Version 1.0.0.10,
![]() Defect fixes: CSCec86478, CSCea05616
Defect fixes: CSCec86478, CSCea05616
Version 2.0.0.2,
![]() Update for Kubrick component manager changes
Update for Kubrick component manager changes
Version 2.0.0.3,
![]() Update to do away with arbitrary port numbers
Update to do away with arbitrary port numbers
Version 2.0.0.4,
![]() Refine cascading and tiling of port windows
Refine cascading and tiling of port windows
Version 2.0.0.5,
![]() Update copyright info in about box
Update copyright info in about box
Version 2.0.0.6,
![]() Update about box formatting
Update about box formatting
© 2005 Cisco Systems, Inc. -- Company Confidential