Port Usage Analyzer
Overview
The Port Usage
Analyzer tool is a suite of 4 reports designed to give administrators a better
idea of the call traffic loads their Unity Connection servers are
experiencing. Reports are generated
in a graphical chart style for easy analysis and can also be saved in simple
CSV files if desired. See below for
details on what each of the four reports available shows.
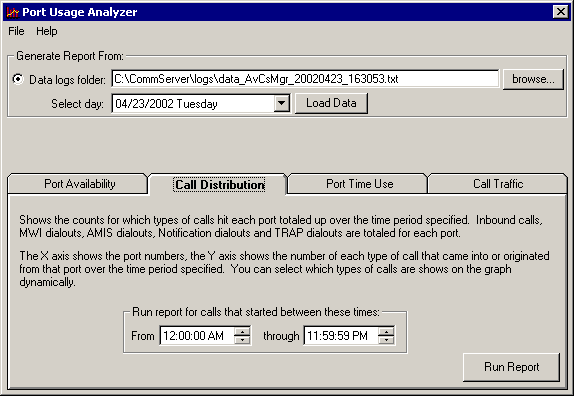
How To Generate a Report
Step 1. Click Browse to browse to the logs directory for Connection. If you are running the Port Usage Analyzer on the Unity Connection server, this will be the default directory. If not, the directory can be found under \Program Files\Cisco Systems\Cisco Unity Connection\Logs. The Port Usage Tool is looking for files named “data_CUCsMgr_*.log” so if you plan on copying the log files off to another box for archiving purposes, be sure to get these data files. When you choose a directory, the Select Day drop-down list is automatically populated with all days for which logging information is available in that directory.
Step 2. Click Select Day, and choose the day you wish to run the report against.
Step 3. Click Load Data.
A progress bar
shows status while the log file is processed into the database from which data
for the reports will be generated. When the processing is complete, a dialog
box pops up, giving summary information about the data found in the log,
including the total number of incoming and outgoing calls and the types of
outgoing calls found.
When the log has been processed,
the reports themselves can be generated.
Step 4. Click the tab for the report you want to see, and click Run Report.
A separate
window opens, showing the graph for that report.
Requirements/Special Notes
This version of Port Usage Analyzer runs on Cisco Unity Connection 1.1 or later.
The Port Usage Analyzer can run on the Unity server or off. When run off box some port information for ports that are not accessed over the period of time the report is run may be missing.
NOTE: When running off box the system must be a Windows 2000, 2003, NT 4.0, XP or ME installation with MDAC 2.7 or later installed. The installation will check for these and not allow the install to continue until those requirements are met. Running on the Unity server will always work since these requirements must be met for Unity Connection to be running.
Port Availability
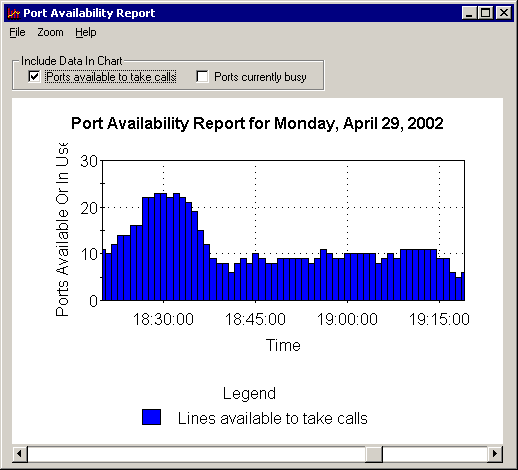
The Port Availability report does not take any parameters; instead, it processes port activity on the log for the entire day. The purpose of this report is to show how many ports are being used and how many are available to process incoming calls at any given time of the day. The report shows a bar for each minute of the day, indicating how many ports are in use and/or how many ports are available to take calls. You can choose to show busy ports, ports available to take calls, or both, by checking the checkboxes at the top of the report form.
The Port Availability report can show the entire day, or you can use the Zoom menu to show a 12-hour, 4-hour, or 1-hour chunk of the day. By default it shows a 12 hour chunk of the day from 6am to 6pm. The following screen shot shows an hour of port activity from 6:15 pm to 7:15 pm (all times are shown in 24-hour clock format). The report was set up with the default mode of showing the number of ports available to take or make calls on the Unity server. Note that as the bars get closer to 0, the number of ports available for processing new messages or generate new outgoing calls goes to 0. This report format makes it easier to see when port resources are getting critically low.
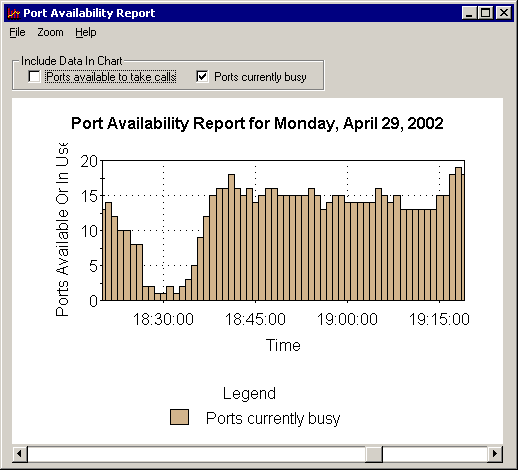
The following shot is of the same log for the same time frame, but instead the ports currently in use is shown. Remember, the ports available to take/make calls may not simply be the total number of ports on the system minus the number of ports busy. If some ports are configured for dedicated dial out purposes such as MWI or notification only this numbers will vary. This is why the number of ports available to take/make calls is logged separately for this report.
Under the File menu, the following options are available (these options are common to all four reports):
![]() Print Chart—Prints the report graph
exactly as it appears (for example, with the zoom setting and position currently
set).
Print Chart—Prints the report graph
exactly as it appears (for example, with the zoom setting and position currently
set).
![]() Save Chart as Bitmap—Saves the
report graph exactly as it appears as a bitmap file to the location of your
choice.
Save Chart as Bitmap—Saves the
report graph exactly as it appears as a bitmap file to the location of your
choice.
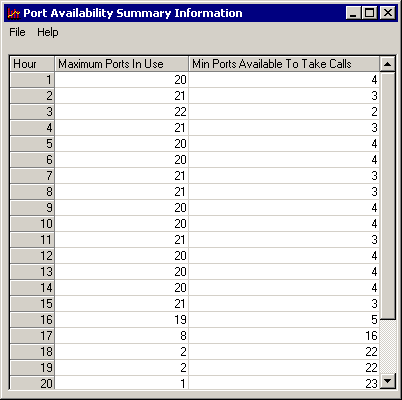
![]() Show Summary Information—Produces a
table of data that can be saved as a CSV file. For the Port Availability
report, the summary information is a list of the minimum number of ports
available to take calls and the maximum number of ports in use for each hour of
the day.
Show Summary Information—Produces a
table of data that can be saved as a CSV file. For the Port Availability
report, the summary information is a list of the minimum number of ports
available to take calls and the maximum number of ports in use for each hour of
the day.
The following screen shot shows the summary information for the Port Availability report.
Call Distribution
The call distribution report shows what types of calls are coming in or going out of each port over the time range specified. By default the report is run for the entire day and shows totals of call types for each port however you can select a custom time range to run against. The following screen shot shows the call activity on a very lightly used 24 port system:
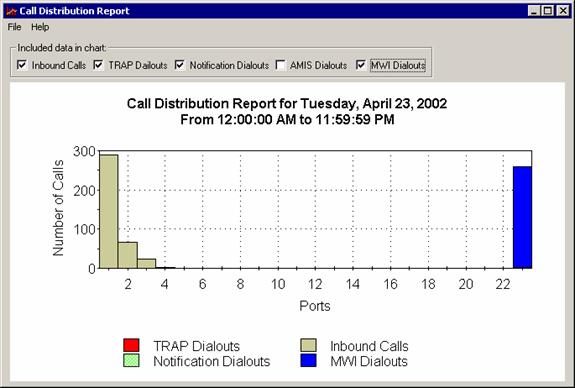
You can tell the system has a “first available” hunt group setup since port 1 gets the most activity and it tails off through port 4 which gets almost none. You can dictate which call types show on the chart by selecting the checkboxes at the top of the chart. For instance if we remove the incoming calls and the MWI dial outs from the above chart, it looks like this:
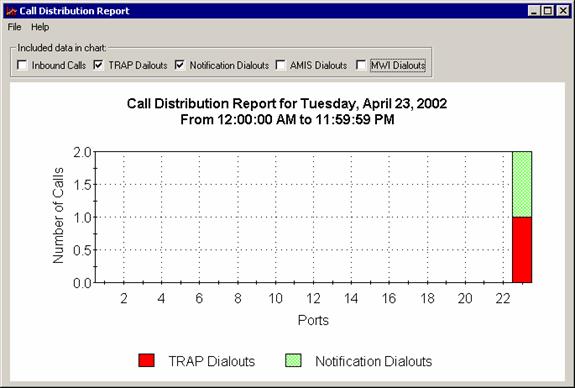
You can now see that there were a few TRAP and notification dialouts (actually, one each) hiding under the pile of hundreds of MWI dialouts. The chart will automatically rescale itself to match as shown above.
Under the File menu, the following options are available (these options are common to all four reports):
![]() Print Chart—Prints the report graph
exactly as it appears.
Print Chart—Prints the report graph
exactly as it appears.
![]() Save Chart as Bitmap—Saves the
report graph exactly as it appears as a bitmap file to the location of your
choice.
Save Chart as Bitmap—Saves the
report graph exactly as it appears as a bitmap file to the location of your
choice.
![]() Show Summary Information—Produces a
table of data that can be saved as a CSV file. For the Call Distribution
report, the summary information is a list of each port and how many calls of
each of the 5 type came into or originated from that port.
Show Summary Information—Produces a
table of data that can be saved as a CSV file. For the Call Distribution
report, the summary information is a list of each port and how many calls of
each of the 5 type came into or originated from that port.
Port Time Use
The port time use report shows the same type of information that the call distribution report does however instead of showing the number of each type of call to come into or go out of each port over a specified time range, it shows how many seconds each port was busy with each type of call. Be default the report is run over the entire day and the total number of seconds each port was busy with each type of call is shown. The following screen shot shows the same information and time range as the call distribution report shown above.
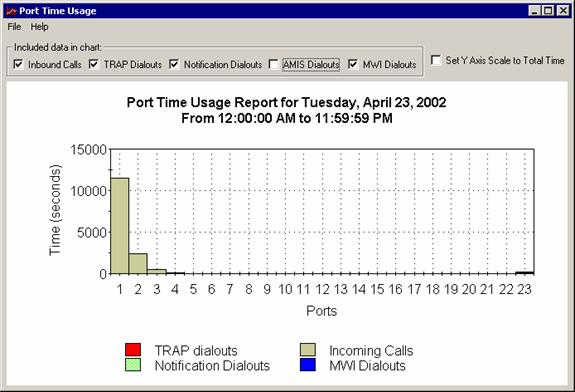
You’ll notice a dramatic difference in the view here since even though there were hundreds of MWI calls that showed up as a large bar in the call distribution report above those same MWI calls barely show up on port 23 at all. This is because MWI dialouts are very quick and take up very little port time. You can dictate which call types are visible in the graph by setting the checkboxes at the top of the report. For instance if we remove the inbound calls from the chart above it looks like this:
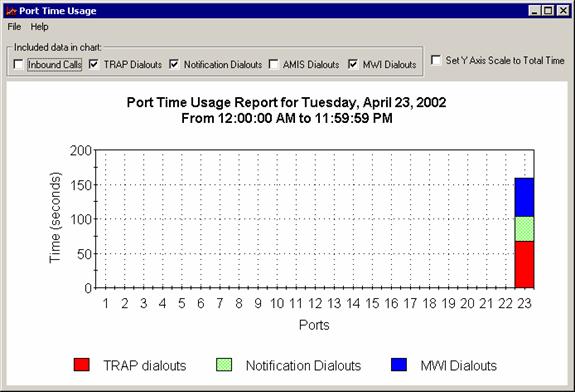
It’s now possible to see the time spent on dial outs on port 23 in more detail. From the call distribution report above we know there was only 1 notification dialout and 1 TRAP dial out and hundreds of MWI dial outs. However the relative time of each call is what counts for this report.
Under the File menu, the following options are available (these options are common to all four reports):
![]() Print Chart—Prints the report graph
exactly as it appears.
Print Chart—Prints the report graph
exactly as it appears.
![]() Save Chart as Bitmap—Saves the
report graph exactly as it appears as a bitmap file to the location of your
choice.
Save Chart as Bitmap—Saves the
report graph exactly as it appears as a bitmap file to the location of your
choice.
![]() Show Summary Information—Produces a
table of data that can be saved as a CSV file. For the port time usage report,
the summary information is a list each port and then shows the number of
seconds that port was busy with each of the 5 types of calls over the time
range specified.
Show Summary Information—Produces a
table of data that can be saved as a CSV file. For the port time usage report,
the summary information is a list each port and then shows the number of
seconds that port was busy with each of the 5 types of calls over the time
range specified.
Call Traffic
The call traffic report shows how many of each of the 5 types of calls came into a port or originated from a port for each minute of the day. The report is run over the course of the entire day but you can zoom in from a full 24 hours to as close as 1 hour of data shown at a time using the Zoom menu. This report can be helpful in gauging how many calls are hitting the system during different times of the day, in particular if Unity is acting as a call redirector to internal extensions or the like. In conjunction with the port availability report it should give you a pretty good idea of the traffic load patterns your system is experiencing over the course of a day.
The following shot shows some light traffic hitting a Unity server between 2pm and 3pm:
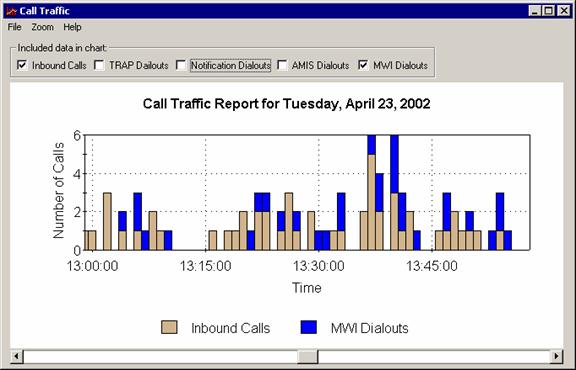
You can dictate which types of calls are visible in the chart by selecting the checkboxes at the top of the chart.
Under the File menu, the following options are available (these options are common to all four reports):
![]() Print Chart—Prints the report graph
exactly as it appears.
Print Chart—Prints the report graph
exactly as it appears.
![]() Save Chart as Bitmap—Saves the
report graph exactly as it appears as a bitmap file to the location of your
choice.
Save Chart as Bitmap—Saves the
report graph exactly as it appears as a bitmap file to the location of your
choice.
![]() Show Summary Information—Produces a
table of data that can be saved as a CSV file. For the call traffic report, the
summary information is a list of number of each type of call came in or
originated on the system totaled up for each hour of the day.
Show Summary Information—Produces a
table of data that can be saved as a CSV file. For the call traffic report, the
summary information is a list of number of each type of call came in or
originated on the system totaled up for each hour of the day.
Revision History
Version 3.0.3 – 9/26/2005
![]() First version for Cisco Unity Connection 1.1
release.
First version for Cisco Unity Connection 1.1
release.
© 2005 Cisco Systems, Inc. -- Company Confidential