Bridge Traffic Analyzer
Non-delivery
Notifications Report
Overview
The Bridge Traffic
Analyzer is a tool that allows administrators to obtain traffic data on their
·
total
size of messages sent
·
number
of messages sent
·
which
servers messages have come from or gone to
·
how long
it takes for messages to arrive at their destinations
·
how many
analog ports are in use for message transport
·
How many
failures were there sending and receiving messages between various nodes
How To Generate a Report
Step 1. Click Browse to browse to the logging
share on the
When you
choose a directory, the Select Day drop-down list is automatically populated
with all days for which logging information is available in that directory.
Step 2. Click on the day(s) you wish to see data for in the Select Day box.
Step 3. Click Load Data.
A progress bar
shows status while the log file is processed into the database from which data
for the reports will be generated. When the processing is complete, a dialog
box pops up, giving summary information about the data found in the log,
including the total number of incoming and outgoing calls and the total number
of incoming and outgoing messages that passed through the Bridge during that
time.
When the log has been processed, the reports themselves can be generated.
Step 4. Click the tab for the report you want to see, and click Run Report.
A separate
window opens, showing the graph for that report.
Inbound vs. Outbound Messages
The Bridge server logs all message traffic activity from the perspective that inbound messages are those that come from Octel nodes to the Bridge and are then delivered to the Cisco Unity server(s). Outbound messages are those that go from Cisco Unity servers to the Bridge, and then are delivered to Octel nodes. The Bridge Traffic Analyzer uses this convention throughout its reports.
It is important to note that Cisco Unity sends and receives messages to and from the Bridge server via IP, which is very quick. The Octel nodes, on the other hand, send and receive messages to the Bridge via analog voice lines, which is considerably slower, and is dependant on a potentially limited number of available analog line resources. For this reason, the outbound message traffic is typically the more interesting item to look at in these reports. In fact, the Message Latency report does not even offer the option to view inbound messages, because typically there is very little if any delay between the time a message arrives on the Bridge to the time it is delivered via IP to the Unity node. The remaining three reports offer the option of viewing inbound traffic information, though the default is to show only outbound traffic information.
Requirements/Special Notes
The Bridge Traffic Analyzer requires version 2.1 or later of
the
The Bridge Traffic Analyzer can be run on or off the Cisco Unity server. The only necessity is access to the logging directory on the Bridge server. However, if possible, it is recommended that you not run the tool on the Cisco Unity server, to avoid adding additional overhead.
Understanding Output From Multiple Days
Version 1.0.20 of the Bridge Traffic Analyzer added support for selecting more than one days worth of logs for output. This means somewhat different things for different reports:
- Port Availability Report. This report shows the maximum number of ports busy and the minimum number of ports available across all days the report is run against over the course of a day. The graph shows 24 hours and the output will indicate the maximum ports in use and/or the minimum ports available for that time of the day across all days in the logs.
- Message Latency Report. This report shows all message latency times for each message delivered in the time frame selected. If you run this report across, say, 30 days, the output of the graph will get quite dense.
- Message Queue Activity Report. This report shows the maximum inbound/outbound message queue sizes over the entire time period selected. Again, the graph shows 24 hours and the value at each point in the graph is the maximum messages in queue for that time of day across all days processed.
- Node Message Traffic Report. This shows the total number of messages between nodes for the entire time period. There is no averaging here, these are raw numbers.
- Non-Delivery Notifications. This report shows the total number of NDNs between nodes for the entire time period selected. Again, no averaging is done here, these are straight numbers.
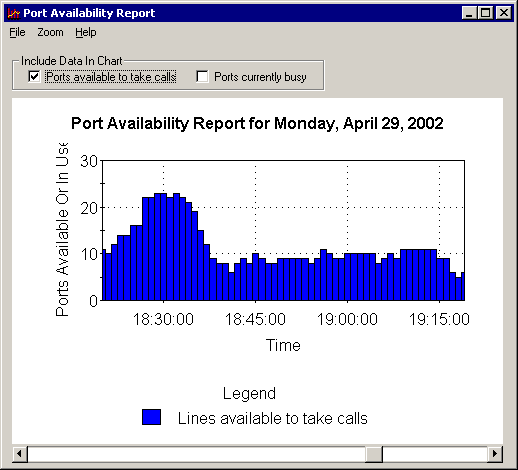
Port Availability Report
The Port Availability report does not take any parameters; instead, it processes analog port activity on the log for the entire day. The purpose of this report is to show how many analog ports on the Bridge are being used to communicate to Octel nodes at any given time of the day. The report shows a bar for each minute of the day, indicating how many ports are in use and/or how many ports are available to take calls. You can choose to show busy ports, ports available to take calls, or both, by checking the checkboxes at the top of the report form.
The Port Availability report can show the entire day, or you can use the Zoom menu to show a 12-hour, 4-hour, or 1-hour chunk of the day. The following screen shot shows an hour of port activity from 6:15 pm to 7:15 pm (all times are shown in 24-hour clock format). The report was set up with the default mode of showing the number of analog ports available to take or make calls on the Bridge server. Note that as the bars get closer to 0, the number of ports available for processing new messages goes to 0. This report format makes it easier to see when port resources are getting critically low. The Bridge does contain logic to terminate message delivery calls in order to free up analog ports when the number of available ports approaches 0, therefore making sure that ports are available to handle inbound calls from Octel nodes. However, heavy inbound message traffic from Octel nodes through to Unity nodes can chew through all the available ports.

The following screen shot shows the same slice of time for the same log, but instead is set up to show the number of ports that are busy.

Under the File menu, the following options are available (these options are common to all four reports):
- Print Chart—Prints the report graph exactly as it appears (for example, with the zoom setting and position currently set).
- Save Chart as Bitmap—Saves the report graph exactly as it appears as a bitmap file to the location of your choice.
- Show Summary Information—Produces a table of data that can be saved as a CSV file. For the Port Availability report, the summary information is a list of the minimum number of ports available to take calls and the maximum number of ports in use for each hour of the day.
The following screen shot shows the summary information for the Port Availability report.
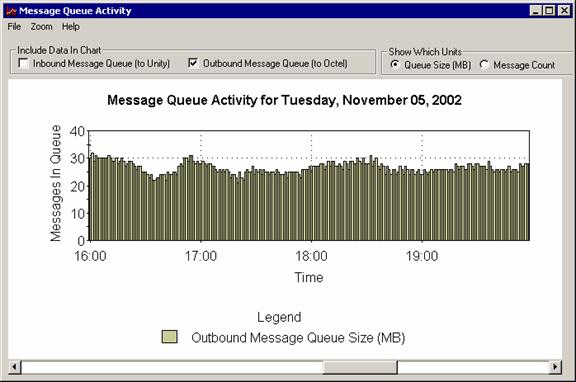
Message Queue Activity Report
The Message Queue Activity report shows how many messages and how much data is passing through the inbound and outbound message queues on the Bridge server. Inbound messages are those traveling from Octel nodes to the Bridge via analog lines and then to the Cisco Unity servers via IP; outbound messages are those traveling from Cisco Unity to the Bridge via IP and then to Octel nodes via analog lines.
Outbound message traffic is the more interesting item to analyze, because this is where bottlenecks may occur. Cisco Unity can quickly route messages to and from the Bridge via IP. It is the ability of the Bridge to get messages out of the queue and to the Octel nodes that may be a problem. Therefore, it is not likely that the inbound message queue will grow very large, but the outbound message queue can back up if port resources are not sufficient to handle the load.
The following screen shot shows 4 hours of activity on a load test and the outbound message queue size over all. You can see that it is staying pretty steady between 25 and 30 megs in size, which is a good, healthy trend.
The following screen shot shows the same log as the previous shot, but zoomed in to a single hour of activity, and showing the number of messages in the queue rather than the size. (As with the Port Availability report, you can zoom in to see anything from 1 hour of data to a full 24-hour view.)
Under the File menu, the following options are available (these options are common to all four reports):
- Print Chart—Prints the report graph exactly as it appears (for example, with the zoom setting and position currently set).
- Save Chart as Bitmap—Saves the report graph exactly as it appears as a bitmap file to the location of your choice.
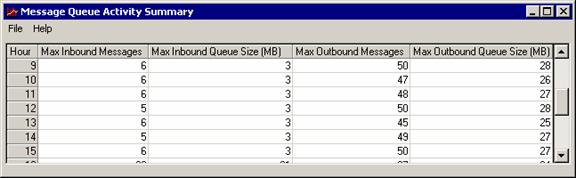
- Show Summary Information—Produces a table of data that can be saved as a CSV file. For the Message Queue Activity report, the summary information is the maximum number of messages in the inbound and outbound queues and the maximum message size of the inbound and outbound queues for each hour of the day.
The following screen shot shows the summary information for the Message Queue Activity report.
Message Latency Report
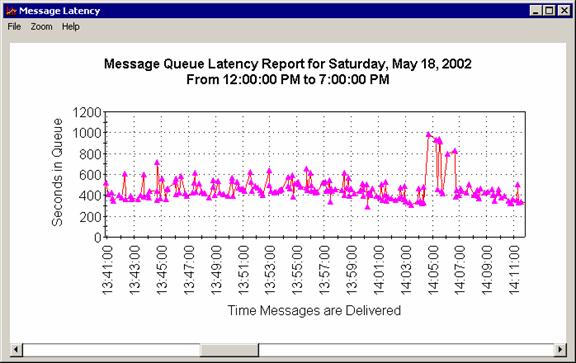
The Message Latency report is designed to allow you to see how long messages sit in the outbound queue before they are delivered to the Octel nodes via the analog lines on the Bridge. This report shows only the outbound messages because inbound messages that arrive on the Bridge are delivered to Cisco Unity via IP, and therefore the total time in the queue is very short. Outbound messages, on the other hand, arrive from Cisco Unity via IP, enter the queue, and then are delivered via analog lines to the target Octel node. If port resources are limited on the Bridge unit, messages can wait in queue for delivery for a long time and thus create a bottleneck.
The Message Latency report allows you to select a time range (the default is a full 24 hours for the log selected) and which nodes to include in the report (the default is all nodes in the log selected). In the following screen shot, the report is set to show messages going from a particular Cisco Unity node to a specific Octel node. The Limit Report Data to Messages Involving These Specific Nodes check box is checked, as are the applicable Unity node and Octel node check boxes. You must select at least one Octel and one Unity node in order to run this report.
The report graphs each outbound message that is delivered. On the X axis, the report indicates when the message was delivered, and on the Y axis, how long the message waited in the queue before being delivered. Note that the X axis shows time in a 24-hour format, and the Y axis shows time spent in the queue in seconds. You can zoom in up to 800 percent, and out to a full 100 percent by using the Zoom menu and the scroll bar to move the chart around. Keep in mind that every message delivered between the Unity and Octel node(s) selected will be shown; therefore, running the report over the entire day, or multiple days, may result in a dense graph. The following screen shot shows sample output.
Under the File menu, the following options are available (these options are common to all four reports):
- Print Chart—Prints the report graph exactly as it appears (for example, with the zoom setting and position currently set).
- Save Chart as Bitmap—Saves the report graph exactly as it appears as a bitmap file to the location of your choice.
- Show Summary Information—Produces a table of data that can be saved as a CSV file. For the Message Latency Report, the summary information is a list of each message delivered between the Octel and Unity node(s) selected over the time range selected. For each message, you get the GUID (for tracking in the Bridge logs), the time the message was delivered, the number of seconds it was in the queue, and the node IDs of the sender (UnityNodeID) and the recipient (OctelNodeID).
The following screen shot shows the summary information for the Message Latency Report.

Node Message Traffic Report
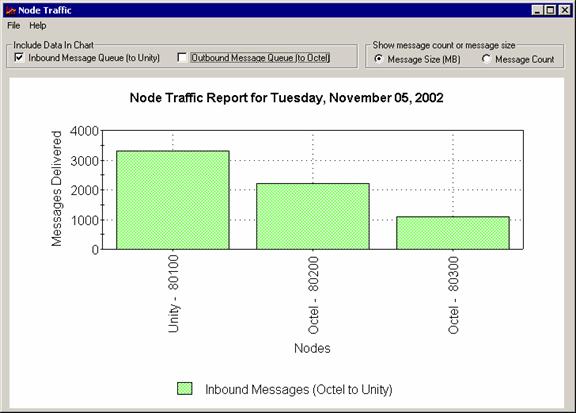
The Node Message Traffic report shows how many messages and how much data is passing between different Unity and Octel nodes. For example, this report can show which Octel nodes a specific Cisco Unity node messages with most heavily. As with the Message Latency report, you can select one or more Unity nodes, one or more Octel nodes, and a time range to run the report against.
In the following screen shot, one Unity node was selected (node ID 80100), and all the Octel nodes that showed up in the log were selected (nodes 80200 and 80300). The report shows inbound traffic from Octel to Cisco Unity as a factor of message size (shown in megabytes). It is immediately apparent that Cisco Unity is getting far more data from node 80200 than from the other node.

In the following screen shot, the Outbound Message Queue option was checked, and this allows us to verify that Cisco Unity is also sending far more data to the Octel node 80200 than the other node.

You can show both inbound and outbound traffic at the same time, and you can also flip between showing message size and message count by selecting the appropriate radio button in the upper left of the report form.
Under the File menu, the following options are available (these options are common to all four reports):
- Print Chart—Prints the report graph exactly as it appears.
- Save Chart as Bitmap—Saves the report graph exactly as it appears as a bitmap file to the location of your choice.
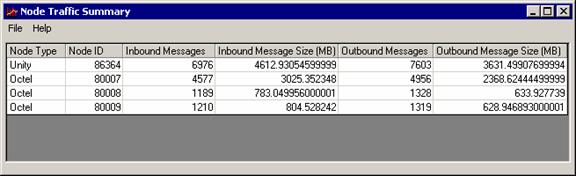
- Show Summary Information—Produces a table of data that can be saved as a CSV file. For the Node Message Traffic report, the summary information is a list of each node and its type (Unity or Octel), the number of inbound messages and total message size delivered to and from that node, and the number of outbound messages and total message size delivered to and from that node. In the case of a Unity node, the inbound messages column indicates how many messages it received from any Octel node, and for Octel nodes the inbound messages column indicates the number of messages it sent to any Unity node. Therefore, the total of the inbound message columns for the Octel nodes should equal the total for the Unity inbound message columns. The same holds true for Outbound message columns.
The following screen shot shows the summary information for the Node Message Traffic report.

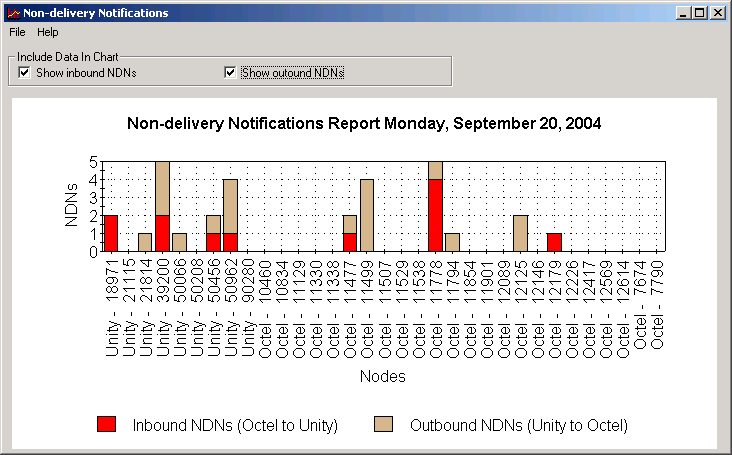
Non-delivery Notifications Report
The Non-delivery Notifications (NDN) report shows which nodes received or sent failure messages as a result of messages that were rejected for whatever reason (full mailbox, destination not valid, transmission error etc…). Inbound NDNs are those that Unity gets in response to a message it was sending that got rejected by the remote Octel node for whatever reason. An Outbound NDN is a message that Unity sends in response to rejecting an inbound message for whatever reason.
A typical Non-delivery Notifications report is shown in the following screen shot:
Each NDN will result in a value being added to BOTH nodes involved. So if Unity 123 rejected a message from Octel node 456, for the outbound NDNs nodes 123 and 456 would have a value added to that bar in the chart. As such if there are a total of 10 inbound NDNs reported in the summary when you load a log file, you should see a total of 20 for all inbound NDNs in the chart (10 on Unity nodes and 10 on Octel nodes). The same applies for outbound, of course.
Under the File menu, the following options are available (these options are common to all four reports):
- Print Chart—Prints the report graph exactly as it appears.
- Save Chart as Bitmap—Saves the report graph exactly as it appears as a bitmap file to the location of your choice.
- Show Summary Information—Produces a table of data that can be saved as a CSV file. For the non-delivery Notifications report, the summary information is a list of each node and its type (Unity or Octel), the number of inbound NDNs, and the number of outbound NDNs. In the case of a Unity node, the inbound NDNs column indicates how many messages sent from Unity subscribers with this serial number could not be delivered to the intended Octel subscribers, and the outbound NDNs column indicates how many messages sent from Octel subscribers could not be delivered to the intended Unity subscribers with this serial number. In the case of an Octel node, the inbound NDNs column indicates how many messages sent from Unity subscribers could not be delivered to the intended Octel subscribers with this serial number, and the outbound NDNs column indicates how many messages sent from Octel subscribers with this serial number could not be delivered to the intended Unity subscribers. Therefore, the total inbound NDNs column for the Octel nodes should equal the total for the Unity nodes. The same holds true for the Outbound NDNs column.
The following screen shot shows the summary information for the Non-delivery Notifications report.

Obtaining Updates
To check for updates to this tool, visit http://www.CiscoUnityTools.com
Revision History
Version 1.0.23 – 5/8/2006
- Fixed a problem with the automatic version check – CSCsd75525
Version 1.0.22 – 11/17/2004
- Fixed a problem with summary reports running off box in some cases – had to do with differences in driver support for the “filter” function on recordsets.
Version 1.0.21 – 10/14/2004
- Added support for running the report across multiple days
- Fixed a problem where the node selection list for the NDN report was no clearing in between log loads – as a result multiple entries for each node would be added to the list.
- Changed reports to be modal such that you must close the report before you can run another. This prevents problems with folks accidentally leaving a report up and changing the time frame and having the report not “re crunch” the data.
Version 1.0.18 – 10/6/2004
- Added new “Node Delivery Error” report to the tool
- Fixed a bug with the time frame option on the Node Message Traffic report
Version 1.0.17 – 4/13/2004
- Added support for localized versions of help files
Version 1.0.15 – 8/27/2003
- Updated resource strings
- Updated TDRT.EXE version in the setup package
Version 1.0.14
- Added checks for updated version of application
- Forced application to run at low priority
Version 1.0.12
- Updated help file, including screen shots, to remove any references to “Octel Net” – fixes CSCdx71158
Version 1.0.11
- Gave up and ripped out the data control that two of the report graphs were binding to (port availability and message queue activity report) and manually populate the data for the graph. This is a lot slower than binding to the data control on the fly but MS has multiple problems with the dependency list for the data control required and it was failing to install and run properly on too many boxes so I took the performance hit. I’m searching for a better graph control that will let me bind directly to a recordset programmatically…
Version 1.0.10
- Fixed problem with a couple reports not running on some systems. This was related to the data control DLLs required not being included in the setup package due to missing dependency information.
- Fixed
problem with the message latency report indicating no message info was
found in the database on some systems. This turned out to be related to
differences between
- Fixed problem with bogus “file not found” error at startup
Version 1.0.8
- Force .MDB files locally to be read/write at startup. The Unity install marks these files as read only which can cause problems
- Updated help file
Version 1.0.7
- Removed references to “OctelNet”.
- Updated to be localizable
Version 1.0.6
- Added time slicing logic to reduce CPU impact when running on the Unity server
- Improved performance of several reports and report cleanup logic.
- Fixed problem with CSV export for the Message Latency report (CSCdx71170)
Version 1.0.3
- First release of tool
© 2004 Cisco Systems, Inc. -- Company Confidential