Port Usage Analyzer
Overview
The Port Usage
Analyzer tool is a suite of 4 reports designed to give administrators a better
idea of the call traffic loads their Unity servers are experiencing. Reports are generated in a graphical
chart style for easy analysis and can also be saved in simple CSV files if
desired. See below for details on
what each of the four reports available shows.
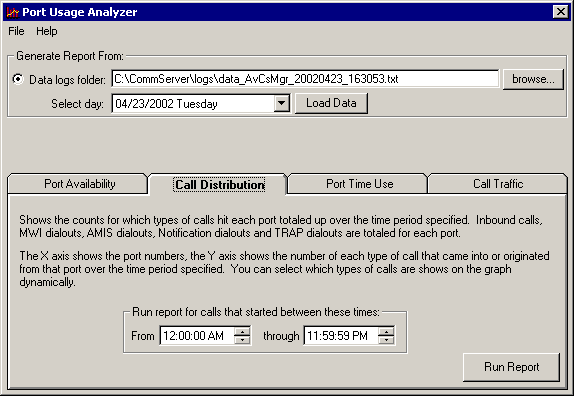
How To Generate a Report
Step 1. Click Browse to browse to the logs directory for Commserver. If you are running the Port Usage Analyzer on the Unity server, this will be the default directory. If not, the directory can be found under \Commserver\Logs. The Port Usage Tool is looking for files named “data_AVCsMgr_*.log” so if you plan on copying the log files off to another box for archiving purposes, be sure to get these data files. When you choose a directory, the Select Day drop-down list is automatically populated with all days for which logging information is available in that directory.
Step 2. Click Select Day, and choose the day you wish to run the report against.
Step 3. Click Load Data.
A progress bar
shows status while the log file is processed into the database from which data
for the reports will be generated. When the processing is complete, a dialog
box pops up, giving summary information about the data found in the log,
including the total number of incoming and outgoing calls and the types of
outgoing calls found.
When the log has been processed, the reports themselves can be generated.
Step 4. Click the tab for the report you want to see, and click Run Report.
A separate
window opens, showing the graph for that report.
Requirements/Special Notes
The Port Usage Analyzer requires Unity 3.1(4) or later or Cisco Unity Connection 2.1 or later to run. The logging details necessary to generate these reports did not exist in previous versions of Unity.
The Port Usage Analyzer can run on the Unity server or off, however it is recommended that you run off box if you can to avoid additional processing overhead on the Unity server.
Port Availability
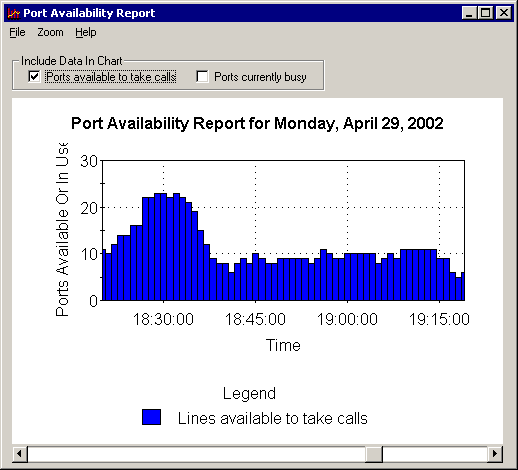
The Port Availability report does not take any parameters; instead, it processes port activity on the log for the entire day. The purpose of this report is to show how many ports are being used and how many are available to process incoming calls at any given time of the day. The report shows a bar for each minute of the day, indicating how many ports are in use and/or how many ports are available to take calls. You can choose to show busy ports, ports available to take calls, or both, by checking the checkboxes at the top of the report form.
The Port Availability report can show the entire day, or you can use the Zoom menu to show a 12-hour, 4-hour, or 1-hour chunk of the day. By default it shows a 12 hour chunk of the day from 6am to 6pm. The following screen shot shows an hour of port activity from 6:15 pm to 7:15 pm (all times are shown in 24-hour clock format). The report was set up with the default mode of showing the number of ports available to take or make calls on the Unity server. Note that as the bars get closer to 0, the number of ports available for processing new messages or generate new outgoing calls goes to 0. This report format makes it easier to see when port resources are getting critically low.
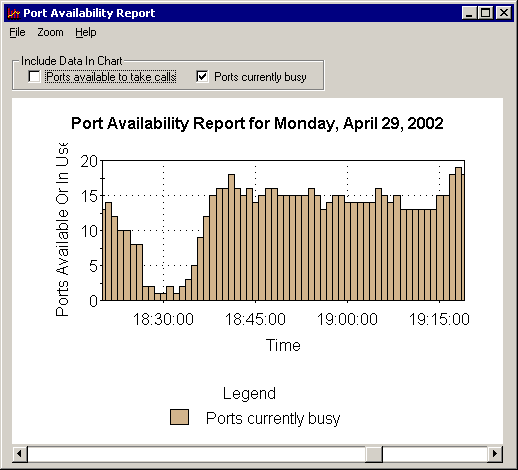
The following shot is of the same log for the same time frame, but instead the ports currently in use is shown. Remember, the ports available to take/make calls may not simply be the total number of ports on the system minus the number of ports busy. If some ports are configured for dedicated dial out purposes such as MWI or notification only this numbers will vary. This is why the number of ports available to take/make calls is logged separately for this report.
Under the File menu, the following options are available (these options are common to all four reports):
- Print Chart—Prints the report graph exactly as it appears (for example, with the zoom setting and position currently set).
- Save Chart as Bitmap—Saves the report graph exactly as it appears as a bitmap file to the location of your choice.
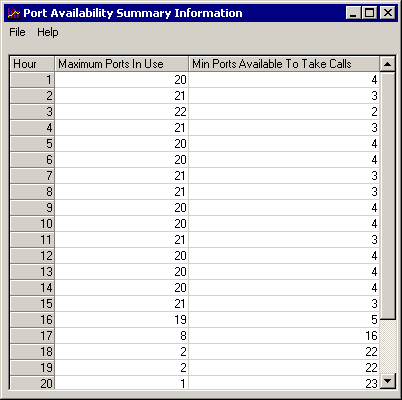
- Show Summary Information—Produces a table of data that can be saved as a CSV file. For the Port Availability report, the summary information is a list of the minimum number of ports available to take calls and the maximum number of ports in use for each hour of the day.
The following screen shot shows the summary information for the Port Availability report.
Call Distribution
The call distribution report shows what types of calls are coming in or going out of each port over the time range specified. By default the report is run for the entire day and shows totals of call types for each port however you can select a custom time range to run against. The following screen shot shows the call activity on a very lightly used 24 port system:
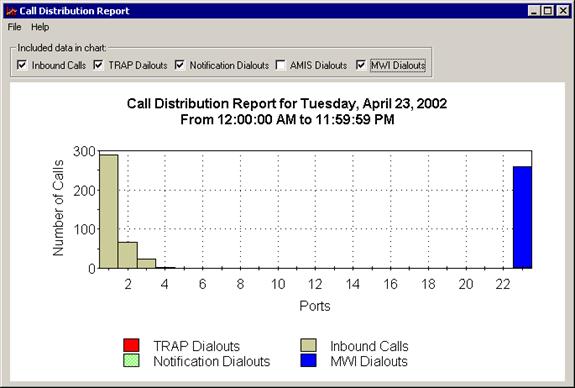
You can tell the system has a “first available” hunt group setup since port 1 gets the most activity and it tails off through port 4 which gets almost none. You can dictate which call types show on the chart by selecting the checkboxes at the top of the chart. For instance if we remove the incoming calls and the MWI dial outs from the above chart, it looks like this:
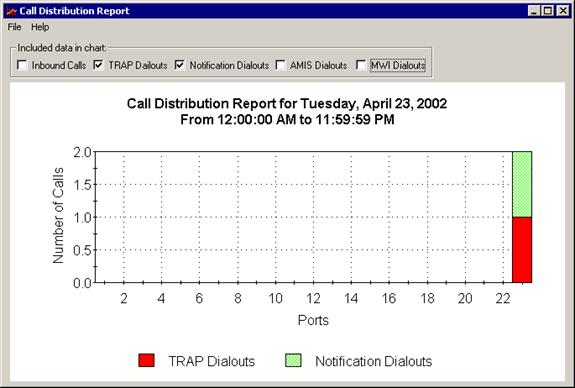
You can now see that there were a few TRAP and notification dialouts (actually, one each) hiding under the pile of hundreds of MWI dialouts. The chart will automatically rescale itself to match as shown above.
Under the File menu, the following options are available (these options are common to all four reports):
- Print Chart—Prints the report graph exactly as it appears.
- Save Chart as Bitmap—Saves the report graph exactly as it appears as a bitmap file to the location of your choice.
- Show Summary Information—Produces a table of data that can be saved as a CSV file. For the Call Distribution report, the summary information is a list of each port and how many calls of each of the 5 type came into or originated from that port.
NOTE: If you have more than 24 ports of data there will be a “Zoom” option available to you to narrow what shows on the screen to only 24 ports and let you scroll back and forth through your port output.
Port Time Use
The port time use report shows the same type of information that the call distribution report does however instead of showing the number of each type of call to come into or go out of each port over a specified time range, it shows how many seconds each port was busy with each type of call. Be default the report is run over the entire day and the total number of seconds each port was busy with each type of call is shown. The following screen shot shows the same information and time range as the call distribution report shown above.
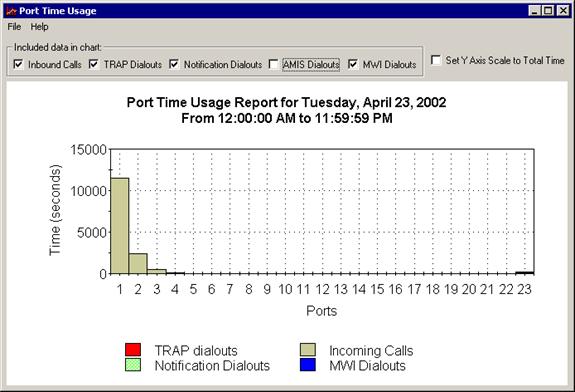
You’ll notice a dramatic difference in the view here since even though there were hundreds of MWI calls that showed up as a large bar in the call distribution report above those same MWI calls barely show up on port 23 at all. This is because MWI dialouts are very quick and take up very little port time. You can dictate which call types are visible in the graph by setting the checkboxes at the top of the report. For instance if we remove the inbound calls from the chart above it looks like this:
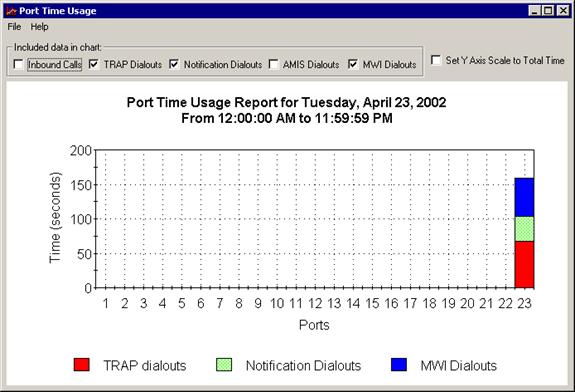
It’s now possible to see the time spent on dial outs on port 23 in more detail. From the call distribution report above we know there was only 1 notification dialout and 1 TRAP dial out and hundreds of MWI dial outs. However the relative time of each call is what counts for this report.
Under the File menu, the following options are available (these options are common to all four reports):
- Print Chart—Prints the report graph exactly as it appears.
- Save Chart as Bitmap—Saves the report graph exactly as it appears as a bitmap file to the location of your choice.
- Show Summary Information—Produces a table of data that can be saved as a CSV file. For the port time usage report, the summary information is a list each port and then shows the number of seconds that port was busy with each of the 5 types of calls over the time range specified.
NOTE: If you have more than 24 ports of data there will be a “Zoom” option available to you to narrow what shows on the screen to only 24 ports and let you scroll back and forth through your port output.
Call Traffic
The call traffic report shows how many of each of the 5 types of calls came into a port or originated from a port for each minute of the day. The report is run over the course of the entire day but you can zoom in from a full 24 hours to as close as 1 hour of data shown at a time using the Zoom menu. This report can be helpful in gauging how many calls are hitting the system during different times of the day, in particular if Unity is acting as a call redirector to internal extensions or the like. In conjunction with the port availability report it should give you a pretty good idea of the traffic load patterns your system is experiencing over the course of a day.
The following shot shows some light traffic hitting a Unity server between 2pm and 3pm:
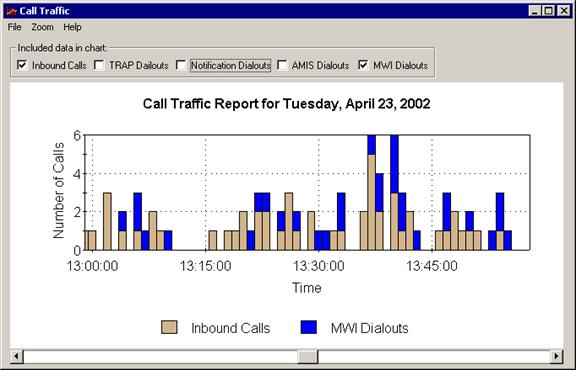
You can dictate which types of calls are visible in the chart by selecting the checkboxes at the top of the chart.
Under the File menu, the following options are available (these options are common to all four reports):
- Print Chart—Prints the report graph exactly as it appears.
- Save Chart as Bitmap—Saves the report graph exactly as it appears as a bitmap file to the location of your choice.
- Show Summary Information—Produces a table of data that can be saved as a CSV file. For the call traffic report, the summary information is a list of number of each type of call came in or originated on the system totaled up for each hour of the day.
Revision History
Version 2.0.5 – 9/29/2009
- Updated version check routine for new CiscoUnityTools.com site design.
Version 2.0.4 – 6/25/2009
- Moved maximum ports to 256
Version 2.0.3 – 6/10/2009
- Updated maximum ports to support 144 port systems.
- Added “Zoom” menu options to the port time usage and call distribution reports so the graphs can be narrowed to show only 24 ports of data at a time.
Version 2.0.2 – 9/27/2006
- Fixed problem with handling different date/time formats for local changes. CSCsg06666
Version 2.0.1 – 7/19/2005
- Added support for the Cisco Unity Connection 2.1 release
- Updated About box copyright info.
- Switched setup over to Install Shield
Version 1.0.67 – 6/21/2005
- Changed the directory selection dialog to be more in line with other tools. CSCsb17164.
- Changed the wording displayed to users when no call data is found in the selected logs. CSCsb16196
Version 1.0.66 – 3/30/2005
- Fixed a problem where the maximum number of ports would not be reflected in a couple of reports if no inbound calls or MWI/AMIS calls came in or went out of the top port number. This caused some information to be truncated for the distribution and port time user reports in rare cases.
Version 1.0.65 – 11/17/2004
- Fixed a problem for off box installations that was causing summary reports to fail. Differences in MDAC drivers being installed caused the issue with filters on recordsets.
Version 1.0.64 – 10/14/2004
- Fixed a problem where the date/day on the reports could end up being the day _after_ the date selected.
- Fixed a problem where some lines in the DATA logs were being screened out due to a GMT conversion error.
- Fixed a problem where time zones ahead of GMT would shift data in the graph output.
- Changed the X axis labels from dynamic time lists to static values. This was necessary to handle different regional settings which caused the time format output of the chart control to show invalid time ranges.
Version 1.0.61 – 3/24/2004
- Compensated for the fact that the log manager can add up to 30 minutes of data from the next day into the log stamped for a particular date. This caused the date stamps on some of the reports to read for the day after the selected report date.
Version 1.0.60 – 11/21/2003
- Fixed problem where log files would be parsed in for the wrong day based on the “time created” flag on the file itself instead of pulling the date off the file name itself.
Version 1.0.59 – 8/21/2003
- Fixed problem with Unity 3.1(6) where the logging ID for call information changed from 1163 to 1165 resulting in a “no call information found” message when attempting to generate reports.
Version 1.0.58
- Forced application to run at low priority
Version 1.0.57
- Log ID for 4.0(1) will be set to 30300 and will stay there moving forward
Version 1.0.56
- Another log ID issue… now including 1162 to the list…
Version 1.0.55
- Fixed a problem with the port availability and port time usage reports where the data control would not load properly on some systems. I wasn’t able to figure out why so the data control was removed and we load the info for those reports “by hand”. Takes a little longer but works on all boxes regardless.
- Fixed a problem with the install not setting the Tools Depot help link up properly
Version 1.0.54
- Fixed problem with event ID for call progress data changing from 1163 to 1164 between versions of 3.1 and to 2093 in 4.0. This was causing call related data to be skipped while processing logs in some versions.
- Fixed problem with x axis value labels in the port time usage and call distribution reports.
- Fixed problem where back end database was getting labeled as “Read only” during the Unity installation
Version 1.0.53
- Fixed problem where port time usage would show negative values in some cases
- Made time slicing more aggressive for both the file crunching and the database construction routines to keep from affecting Unity functionality too badly when run on box.
Version 1.0.52
- Fixed problem parsing files across a network share
- Fixed issue where some reports did not generate properly if there were very few calls in the log
- Added time slicing logic to reduce impact to CPU when running on the Unity server
Version 1.0.48
- Fixed problem with the setup were VB5DB.DLL was not being copied onto the system
- Removed radio button on main form that shouldn’t have been there
- Removed invalid reference to Unity 3.1(3) – Unity 3.1(4) is the required minimum version.
Version 1.0.47
- First release of tool
© 2005 Cisco Systems, Inc. -- Company Confidential